Archive
BOE: Rates of Change in Antarctic Ice Core Temperatures

Another line of argument for a catastrophic impact of climate change is in the rate of change of global temperatures and/or ocean acidification. In this post, I’m going to poke a bit at the rates of change in global temperature via ice core data. This step – from globally to particular Antarctic locations – is questionable and I’ll look closer to see if this is justified in a latter post. With that said, what do the ice cores hold ….?
BOE: Quantifying Catastrophe … Now with CH4!!!

The fact that the ice core records do not seem full of methane spikes due to high-latitude sources makes it seem like the real world is not as sensitive as we were able to set the model up to be. This is where my guess about a worst-case 1000 Gton from hydrates after 2000 Gton C from fossil fuels in the last paragraph comes from.
Much ado about methane (Real Climate, Archer, Jan 4, 2012)
Colorado River Basin Storage: Lake Mead and Lake Powell

Some of my first comments on WUWT were in regards to Lake Powell water levels. Even then I understood that to correctly document water levels on the Colorado River Basin, you had to look, as a minimum, at both Mead and Powell. There was a new river operations approach begun in 2005, formalized in 2007, which has had the net effect of slowly increasing the water levels in Lake Powell, but at the expense of Lake Mead. Indeed, there was little change in the river system as a whole from 2005-2010, with combined water storage for the two reservoirs bouncing around 50%. This winter was the first year in the last eight or so with a sustained improvement in storage – although whether that can be maintained is still in question with forecasts of widespread low water flows.
wxcalc: building a library of weather related functions


As we saw in the previous thread, the activity of eolian sands can be characterized by the ratio of precipitation to potential evapotranspiration. In order to calculate the latter, I need access to some weather related functions such as the derivation of vapor pressure from dew point temperature. Searching for the equations I needed, I stumbled over the “Weather Calculator” site (by Tim Brice and Todd Hall) hosted on a El Paso, Texas NOAA NWS site. While the calculator isn’t of much use for me, the equations behind it were available in a set of pdf files.
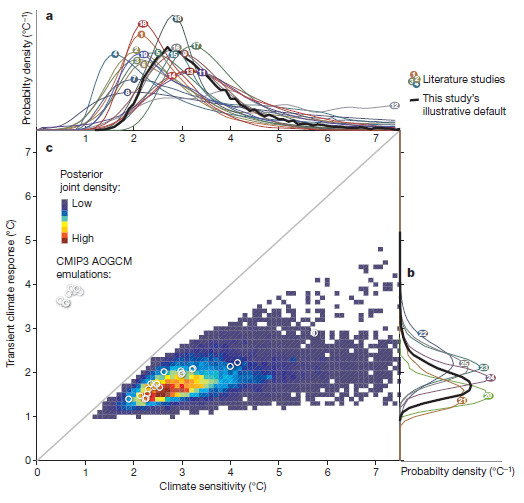
BOE: Gamma PDF Estimate of Equilibrium Climate Sensitivity

Estimating the probability distribution for equilibrium climate sensitivity with a Gamma distribution visually fitted to Meinshausen 2009 Fig 3a” (top). The gamma distribution for the 2 to 4.5C spread for equilibrium climate sensitivity has a cumulative 85% probability.
